For economics tutors
How to teach economics online on a whiteboard: a price elasticity lesson, step by step
Economics is taught through graphs and short calculations. Online, the question is where you draw the graph and whether your student works on it with you. This page walks through one lesson, price elasticity of demand, and says plainly what Instaboard does for economics: graphs are hand-drawn ink, and there is no graph plotter, no equation solver and no diagram library.
Updated
The short answer
- Use the board as a graph-and-working page. Draw the curve, work the calculation beside it, then let your student do the next case on the same page.
- Graphs are hand-drawn ink on Instaboard. There is no graph plotter, no equation solver and no diagram library. For an exact curve, share a graphing tool and keep the board for the reasoning.
- Make the student draw and calculate, not only watch. A UK tutoring platform's help page says quantitative subjects, economics included, need equations and problems written by hand in the tutorial, and students in an IB forum thread say drawing the graphs by hand is good exam practice.
- Students can view with no account but need a free sign-in to write. Free calls run 60 minutes; Pro ($5 a month billed yearly) has no limit.
What a lesson on the board looks like
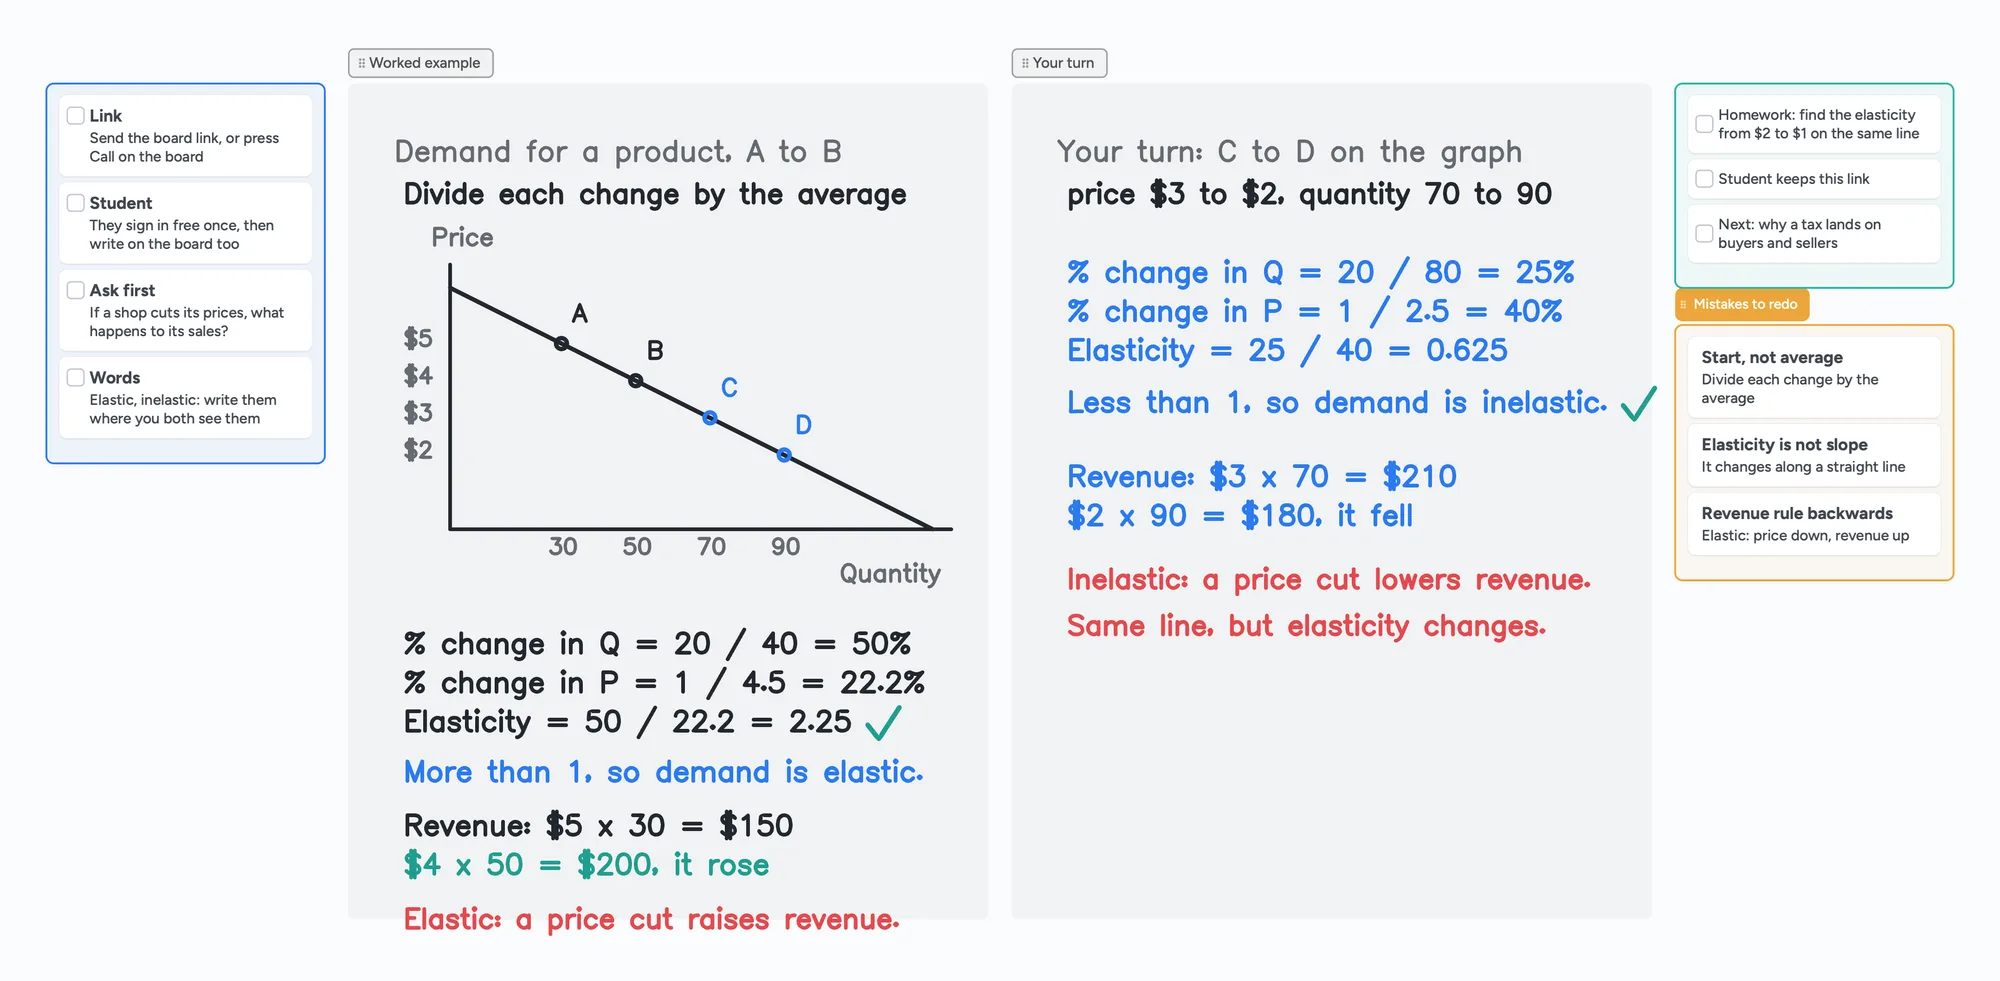
The call sits on top of the board, so you talk and write in the same place. You draw the graph and work the first pair of points, your student works the next pair in their own colour, and you tick it.
What an economics tutor does on a whiteboard
A 2021 help page from the tutoring platform Spires says tutors of quantitative subjects, and it names economics, will almost certainly need to write equations or solve problems by hand in their tutorials. In a 2017 r/IBO thread on typed or handwritten economics notes, most of the 17 replies say to handwrite because the graphs are easier to draw by hand and the exam is on paper, so drawing them quickly becomes routine; one reply says typing works better for them. Those are individual views, but they point to four jobs for the board:
- Draw the graph. A demand or supply curve, with the points you will use labelled.
- Work the calculation beside it, one line at a time, so the student sees the order.
- Let the student do the next case in their own colour and say what the answer means.
- Keep a reusable page. Leave the board open as the revision sheet, and copy it for the next student.
A tablet or pen tablet makes graphs faster than a mouse; see which pen tablet to buy and online tutoring setup. For the maths side of the same habit, see an online whiteboard for math.
A price elasticity lesson in five steps
OpenStax Principles of Economics 3e, section 5.1, defines the price elasticity of demand as the percentage change in quantity demanded divided by the percentage change in price, and uses the midpoint method: each change is divided by the average of the two values, so you get the same answer going up or down the curve. Demand is elastic when the result is above one and inelastic when it is below one, and the book reports it as an absolute value. Section 5.3 adds the revenue test: if demand is elastic, a price cut raises total revenue; if it is inelastic, a price cut lowers it. The board follows that order with our own made-up numbers on a straight demand line:
- Ask first: if a shop cuts its prices, what happens to its sales and to its takings? Let the student guess before you draw anything.
- Draw the line and the four points: price $5, $4, $3 and $2 against quantity 30, 50, 70 and 90.
- Work A to B with the midpoint method: the quantity change is 20 on an average of 40, which is 50%; the price change is 1 on an average of 4.5, which is 22.2%; so elasticity is 50 divided by 22.2, about 2.25.
- Read it and test it: above one, so demand is elastic; revenue goes from $5 x 30 = $150 to $4 x 50 = $200, so the price cut raised revenue.
- Student's turn, C to D: 20 on 80 is 25%, 1 on 2.5 is 40%, elasticity 0.625, below one, so inelastic; revenue goes from $210 to $180, so the same price cut lowered revenue.
| Move on the line | Elasticity (midpoint) | Demand is | A price cut makes revenue |
|---|---|---|---|
| A to B: $5 to $4, 30 to 50 | 50 / 22.2 = 2.25 | Elastic (above 1) | Rise: $150 to $200 |
| C to D: $3 to $2, 70 to 90 | 25 / 40 = 0.625 | Inelastic (below 1) | Fall: $210 to $180 |
Swipe the table sideways to see every column.
The method and the revenue rule follow OpenStax Principles of Economics 3e, sections 5.1 and 5.3 (read November 2, 2026). The prices and quantities are invented for this lesson, not measured data.
The point worth saying out loud is the red note on the board: it is one straight line, but elasticity is not the same at every point on it. OpenStax makes the same point in section 5.1, where it works two intervals of one straight-line demand curve and gets different elasticities. The usual slips are dividing by the starting value instead of the average, mixing up elasticity with slope, and getting the revenue rule backwards.
Drawing economics on Instaboard
On Instaboard you draw with the pen, like a whiteboard in a room. Here is what that means, so you can decide before the lesson:
- Hand-drawn graphs. Axes, curves, points and arrows are pen drawings, as on the board above. They are not to scale unless you make them so, and the board does not check them.
- Hand-written working. Fractions, percentages and answers are written, not typed. Cards and lists hold typed notes if you want a tidy checklist beside the graph.
- The worksheet or past-paper question. Import the student's PDF and write on it. Each imported PDF uses one of the 5 free boards.
- A textbook figure. You can add an image to a card, but a free board holds 3 images, and drawing the graph with the student is usually the point.
No graph plotter, no equation solver
Instaboard has no built-in graph plotter, no formula solver and no library of economics diagrams. Equation cards typeset a formula, and a Desmos graph can sit on the board as a snapshot that opens the full calculator, but it needs a connection. If you need exact curves or data, use a graphing tool and keep the board for the reasoning.
When another tool is the better choice
- You need exact or data-driven graphs. A graphing tool or a spreadsheet plots to scale; Instaboard's curves are freehand.
- Your student only needs to watch. Screen-share annotation on your own platform is enough if you do not need them to write.
- Your platform already has a whiteboard you like. Keep it if it works for you.
- You want a recording of the lesson. Instaboard does not record.
- You teach a large class. Instaboard has no class mode.
One UK tutoring service's A-Level economics page says students often reproduce diagrams from memory but never use them to carry the argument, and describes its sessions as building diagrams together on a shared whiteboard rather than watching one appear. That is a service's own description, not a study, but it is the case for a board where the student draws too. Instaboard fits when you teach by drawing, you want the student to do the next calculation, and you want the call, the graph and the working on one link.
Use the lesson board in five steps
- Open the economics board above and make it yours.
- Send your student the link, or press Call on the board so the lesson runs in one place. They sign in free once to write.
- Swap in your topic. Replace the demand line with the curve you are teaching, such as a supply shift, a tax or a budget line.
- Let the student do the next case in their own colour and explain the answer out loud.
- Leave the board open as the revision sheet and start the next lesson from it.
The same pattern works for other subjects: how to teach math online, how to teach physics online and how to teach biology online. For a student's own notes, see the supply and demand notes board.
What Instaboard doesn't do for economics
- No graph plotter, no equation solver, no diagram library. Graphs and working are hand-drawn ink.
- No handwriting reading. Handwritten numbers are not searchable or checked.
- Whole-stroke eraser only. You cannot rub out part of a line; erase the stroke and redraw it.
- No recording of the lesson, no class mode, no scheduling.
- Students sign in to write. Anyone with the link can view; writing needs a free sign-in. Free calls run 60 minutes.
- Free covers 5 boards. Each imported PDF uses one of them. Pen strokes do not count toward the 150-item limit; cards and lists do.
- Free boards are shared by link, so use first names only.
Start from the ready board
It opens in your browser in a few seconds, with nothing to install. Sign in for free when you want to save it and share it.
Questions
How do I teach economics on an online whiteboard?
Draw the graph, work the calculation beside it line by line, then let the student do the next case on the same board. Import the student's worksheet or past-paper question as a PDF so you both write on the real question.
Can I draw supply and demand graphs on Instaboard?
Only by hand with the pen. There is no graph plotter or economics diagram library, and the board does not check your drawing. A tablet or pen tablet makes drawing faster than a mouse.
Should my student draw the graphs too?
It is worth trying. A UK tutoring platform's help page says quantitative subjects need working written by hand, and students in an IB forum thread say drawing the graphs by hand is good exam practice. Students write in their own colour on the same page.
What is the midpoint method?
It divides each change by the average of the two values, so the elasticity is the same going up or down between two points. OpenStax Principles of Economics 3e, section 5.1, uses it.
Do I need a tablet to teach economics online?
No, but graphs are slow with a mouse. A touchscreen laptop, an iPad or a pen tablet helps.
Is Instaboard free?
Yes. The free plan includes 5 boards, 150 cards and items across your account (pen strokes, arrows and sections don't count), 3 images and 1 file per board, unlimited collaborators and video calls up to an hour. Pro is $5 a month billed yearly ($59.99 a year), or $7.99 monthly, and the people you invite join free.
Sources
- OpenStax Principles of Economics 3e, 5.1 Price Elasticity of Demand and Price Elasticity of Supply
- OpenStax Principles of Economics 3e, 5.3 Elasticity and Pricing
- Spires Help Center: Using an Online Whiteboard and Digital Pen (September 17, 2021)
- r/IBO: Typed or handwritten economics notes? (October 15, 2017)
- Sessioned: A-Level Economics Tutors, One-to-One Online
Related
How to teach math online: your first lesson, step by step
How to tutor math online as a beginner: what you need, how to run a first lesson on a board your student writes on too, with Zoom, Google Meet or no video app at all, and what to do without a whiteboard.
An online whiteboard for math: write, graph and let your student write too
What a math tutor needs from an online whiteboard: handwriting, typed equations, graphs and worksheets, and which tools have each. Free limits compared, plus a ready slope lesson board.
How to teach physics online on a whiteboard: a series-circuit lesson, step by step
How a physics tutor can teach on an online whiteboard: a series-circuit lesson step by step, hand-drawn diagrams, and when screen share or a simulation is the better tool. Ready lesson board included.
An online whiteboard for tutoring that works the way you teach
A free whiteboard for online tutoring: paste the worksheet, write with a pen, and your student answers on the same board. Call on it or beside Zoom.
A pen tablet for online tutoring: what to buy and how to set it up
Which pen tablet to buy for online tutoring (Wacom, XP-Pen, Huion, about $40 to $60), how to set it up with pen pressure in the browser, and a whiteboard your student can write on too.
Online tutoring setup: what you need before your first lesson
What you need to start tutoring online: sound, light, camera, internet, a way to write, and a board your student writes on too. A plain checklist with a five-minute test call and a ready board to open.